Table of Contents
- 1. What LinkedIn shipped on November 3
- 2. Followers gained now has names attached
- 3. The out-of-network share is your discovery number
- 4. Saves and sends mark the posts people keep
- 5. The export is the part brands will care about
- 6. What to do now
- 7. Frequently asked questions
- 7.1. Where is the Post Performance Table on LinkedIn?
- 7.2. What do in-network and out-of-network mean in LinkedIn analytics?
- 7.3. Can you export LinkedIn post analytics?
Short on time? On November 3, 2026, LinkedIn published a creator's guide to the analytics it has shipped through the year, headlined by a Post Performance Table that puts every post's numbers in one exportable view. Three metrics in it deserve more attention than impressions: followers gained per post, which now shows you the actual people; saves and sends, which mark the posts people keep and pass on; and the in-network versus out-of-network split, which tells you whether a post reached new people or the same ones. Open the table, sort by followers gained, and you will learn more about what grows your audience than impressions ever told you.
What LinkedIn shipped on November 3
Sam Corrao Clanon, LinkedIn's director of product for content, published a walkthrough of the new analytics on November 3, 2026. The centerpiece is the Post Performance Table: every post listed with impressions, members reached, video views and watch time, followers gained, reactions, comments, reposts, saves and sends in one table, so you can compare posts "without needing to open the analytics for each one of your posts individually," as Corrao Clanon put it. It is rolling out globally on desktop starting the week of November 3, with mobile to come, and the whole table can be exported. Per-post detail still sits one click deeper, alongside profile viewers from a post and average video watch time.
Finding it takes four clicks: open Content Analytics on desktop, select Post Impressions, scroll to Most Recent Post Performance, then choose "Show all posts."
The table lives in the Dashboard tab LinkedIn introduced with its October 15 creator bundle, the same announcement that added ad revenue sharing and paid advice sessions, alongside new Creator Marketplace search filters for brands. We covered that half when LinkedIn put a price on creator work. October was about earning. This update is about proving, and Social Media Today's coverage frames it the same way, describing analytics that will help creators "maximize in-app opportunities" as LinkedIn keeps developing new monetization options.
Followers gained now has names attached
LinkedIn already reported how many followers a post earned you. The update adds who. Click the metric and the profiles of the people who followed you from that post are now visible, a change Corrao Clanon says came from creator feedback on the original metric.
That turns growth from a number into something you can audit. Two posts can each bring in twenty followers, and until now they looked identical in your analytics. Check the profiles and one post may have recruited founders in your market while the other collected accounts that will never buy from you, hire you, or read you again. The post worth repeating is not always the one with the bigger count, and this is the first time LinkedIn's own dashboard lets you tell them apart.
The out-of-network share is your discovery number
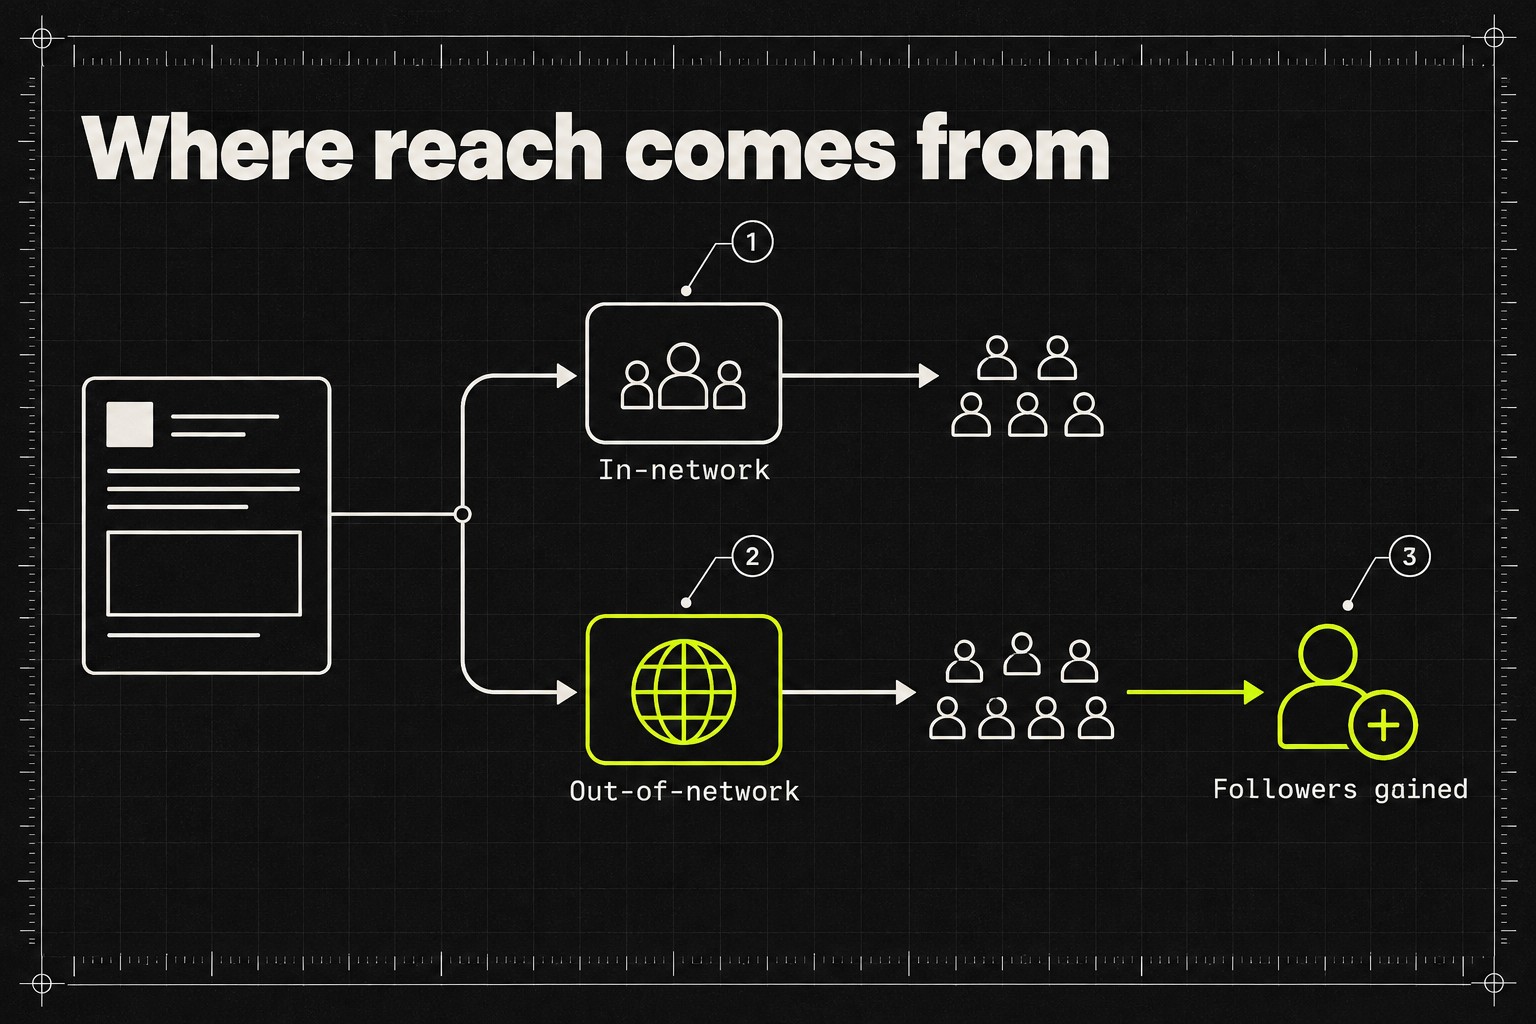
The new In and Out of Network metrics split a post's impressions into two percentages. In-network reach counts people who already follow or are connected to you. Out-of-network reach counts everyone else, people Corrao Clanon describes as "discovering you through distribution surfaces (e.g., feed recommendations, reshares, search, etc.)."
Read it as a diagnosis. A post whose reach is almost all in-network circulated inside your existing bubble. That still nurtures the audience you have, but it recruits nobody new. The out-of-network share is where growth comes from, because strangers can only become followers after something carries your post past your own graph: a reshare, a recommendation, a search result. The split also matches where the feed itself is heading. LinkedIn is testing a dedicated Network feed alongside For You, which we broke down when LinkedIn split the feed into Network and For You tabs, so your analytics now sort reach the same way the feed sorts attention.
Saves and sends mark the posts people keep
Saves counts bookmarks. Sends on LinkedIn counts how many times a post was shared inside a direct message. Both are private acts, which is what makes them honest. A like is public and costs nothing. A save means someone expects to need your post again, and a send means someone staked a little credibility on it in a private conversation.
For anyone selling to other professionals, sends deserve the closer look. A post that travels through DMs is reaching people who may never have seen it in the feed, passed along by someone they trust. If one topic keeps earning saves and sends out of proportion to its impressions, that topic is your reference material. Write more of it, even when the impression count looks ordinary.
The export is the part brands will care about
The table exports, and a new Member Post Analytics API pushes your profile and post analytics into third-party tools, with Hootsuite, Buffer and Later named at launch. One commenter under the announcement made the practical case better than the announcement did: "Most creators do not lose brand deals because their content is weak. They lose because their numbers live in scattered screenshots on their phone. A table that puts every post side by side, and lets you take it out of the app, turns analytics into a media kit."
That is the thread connecting this release to October's. When brands can search the Creator Marketplace by expertise and audience, the creator who can hand over a clean per-post record of followers gained and out-of-network reach negotiates from evidence. Everyone else negotiates from screenshots.
What to do now
Five steps, in order.
- This week: open the table and export it. Content Analytics, Post Impressions, Most Recent Post Performance, Show all posts. The export is your baseline for everything below.
- Sort by followers gained instead of impressions. Find your five best recruiting posts and look at who actually followed. If the people match the audience you want, you have found your content direction. If they do not, the posts that impress are not the posts that grow.
- Check your out-of-network share. If most of your reach is in-network, your content is circulating among people who already follow you. Reshares, recommendations and search carry posts beyond the bubble, and commenting on other people's posts is still the cheapest way to stand in front of an audience you have not built. Our guide to how LinkedIn comments work in 2026 covers the habits; Commentify keeps them running on days you cannot sit in the feed.
- Treat saves and sends as your topic vote. Find the posts where these two run high relative to impressions and note what they have in common. That is the material your audience files away and forwards.
- If you schedule through Hootsuite, Buffer or Later, connect the new API. Post analytics inside the tool you already plan in beats a monthly screenshot ritual.
Two things not to do. Do not pivot your content plan to video just because watch time now has a column; a metric existing does not make it yours. And do not chase out-of-network reach with engagement bait. LinkedIn spent the autumn explaining how it buries generic content, which we covered when LinkedIn explained its slop detection, and the detectors do not care that your motives were analytical.
Frequently asked questions
Where is the Post Performance Table on LinkedIn?
On desktop, open Content Analytics, select Post Impressions, go to Most Recent Post Performance, and choose "Show all posts." It began rolling out globally on desktop the week of November 3, 2026, with mobile to follow, per LinkedIn.
What do in-network and out-of-network mean in LinkedIn analytics?
In-network reach is the percentage of a post's impressions that came from people already connected to or following you. Out-of-network reach is the percentage from everyone else, reached through feed recommendations, reshares and search. A high out-of-network share means the post found new people.
Can you export LinkedIn post analytics?
Yes. The new Post Performance Table has an export option, and LinkedIn's Member Post Analytics API feeds profile and post analytics into third-party tools including Hootsuite, Buffer and Later.
The bottom line: impressions flattered everyone and informed no one. The new table surfaces the numbers that map to outcomes: who followed, who kept the post, who had never heard of you before it. Export it, find the posts that recruit, and stop steering by the vanity column.